4-Way Venn Diagram of Overlapping Gene Expression in R
Visualising the overlap between differentially expressed genes (DEGs) across conditions or species is key to uncovering shared biological pathways from transcriptomics data.
In our recent study published in Plant Methods, we analysed RNAseq data to investigate the impact of GRF-GIF developmental regulator chimeras on gene expression in the strawberry model organism Fragaria vesca.
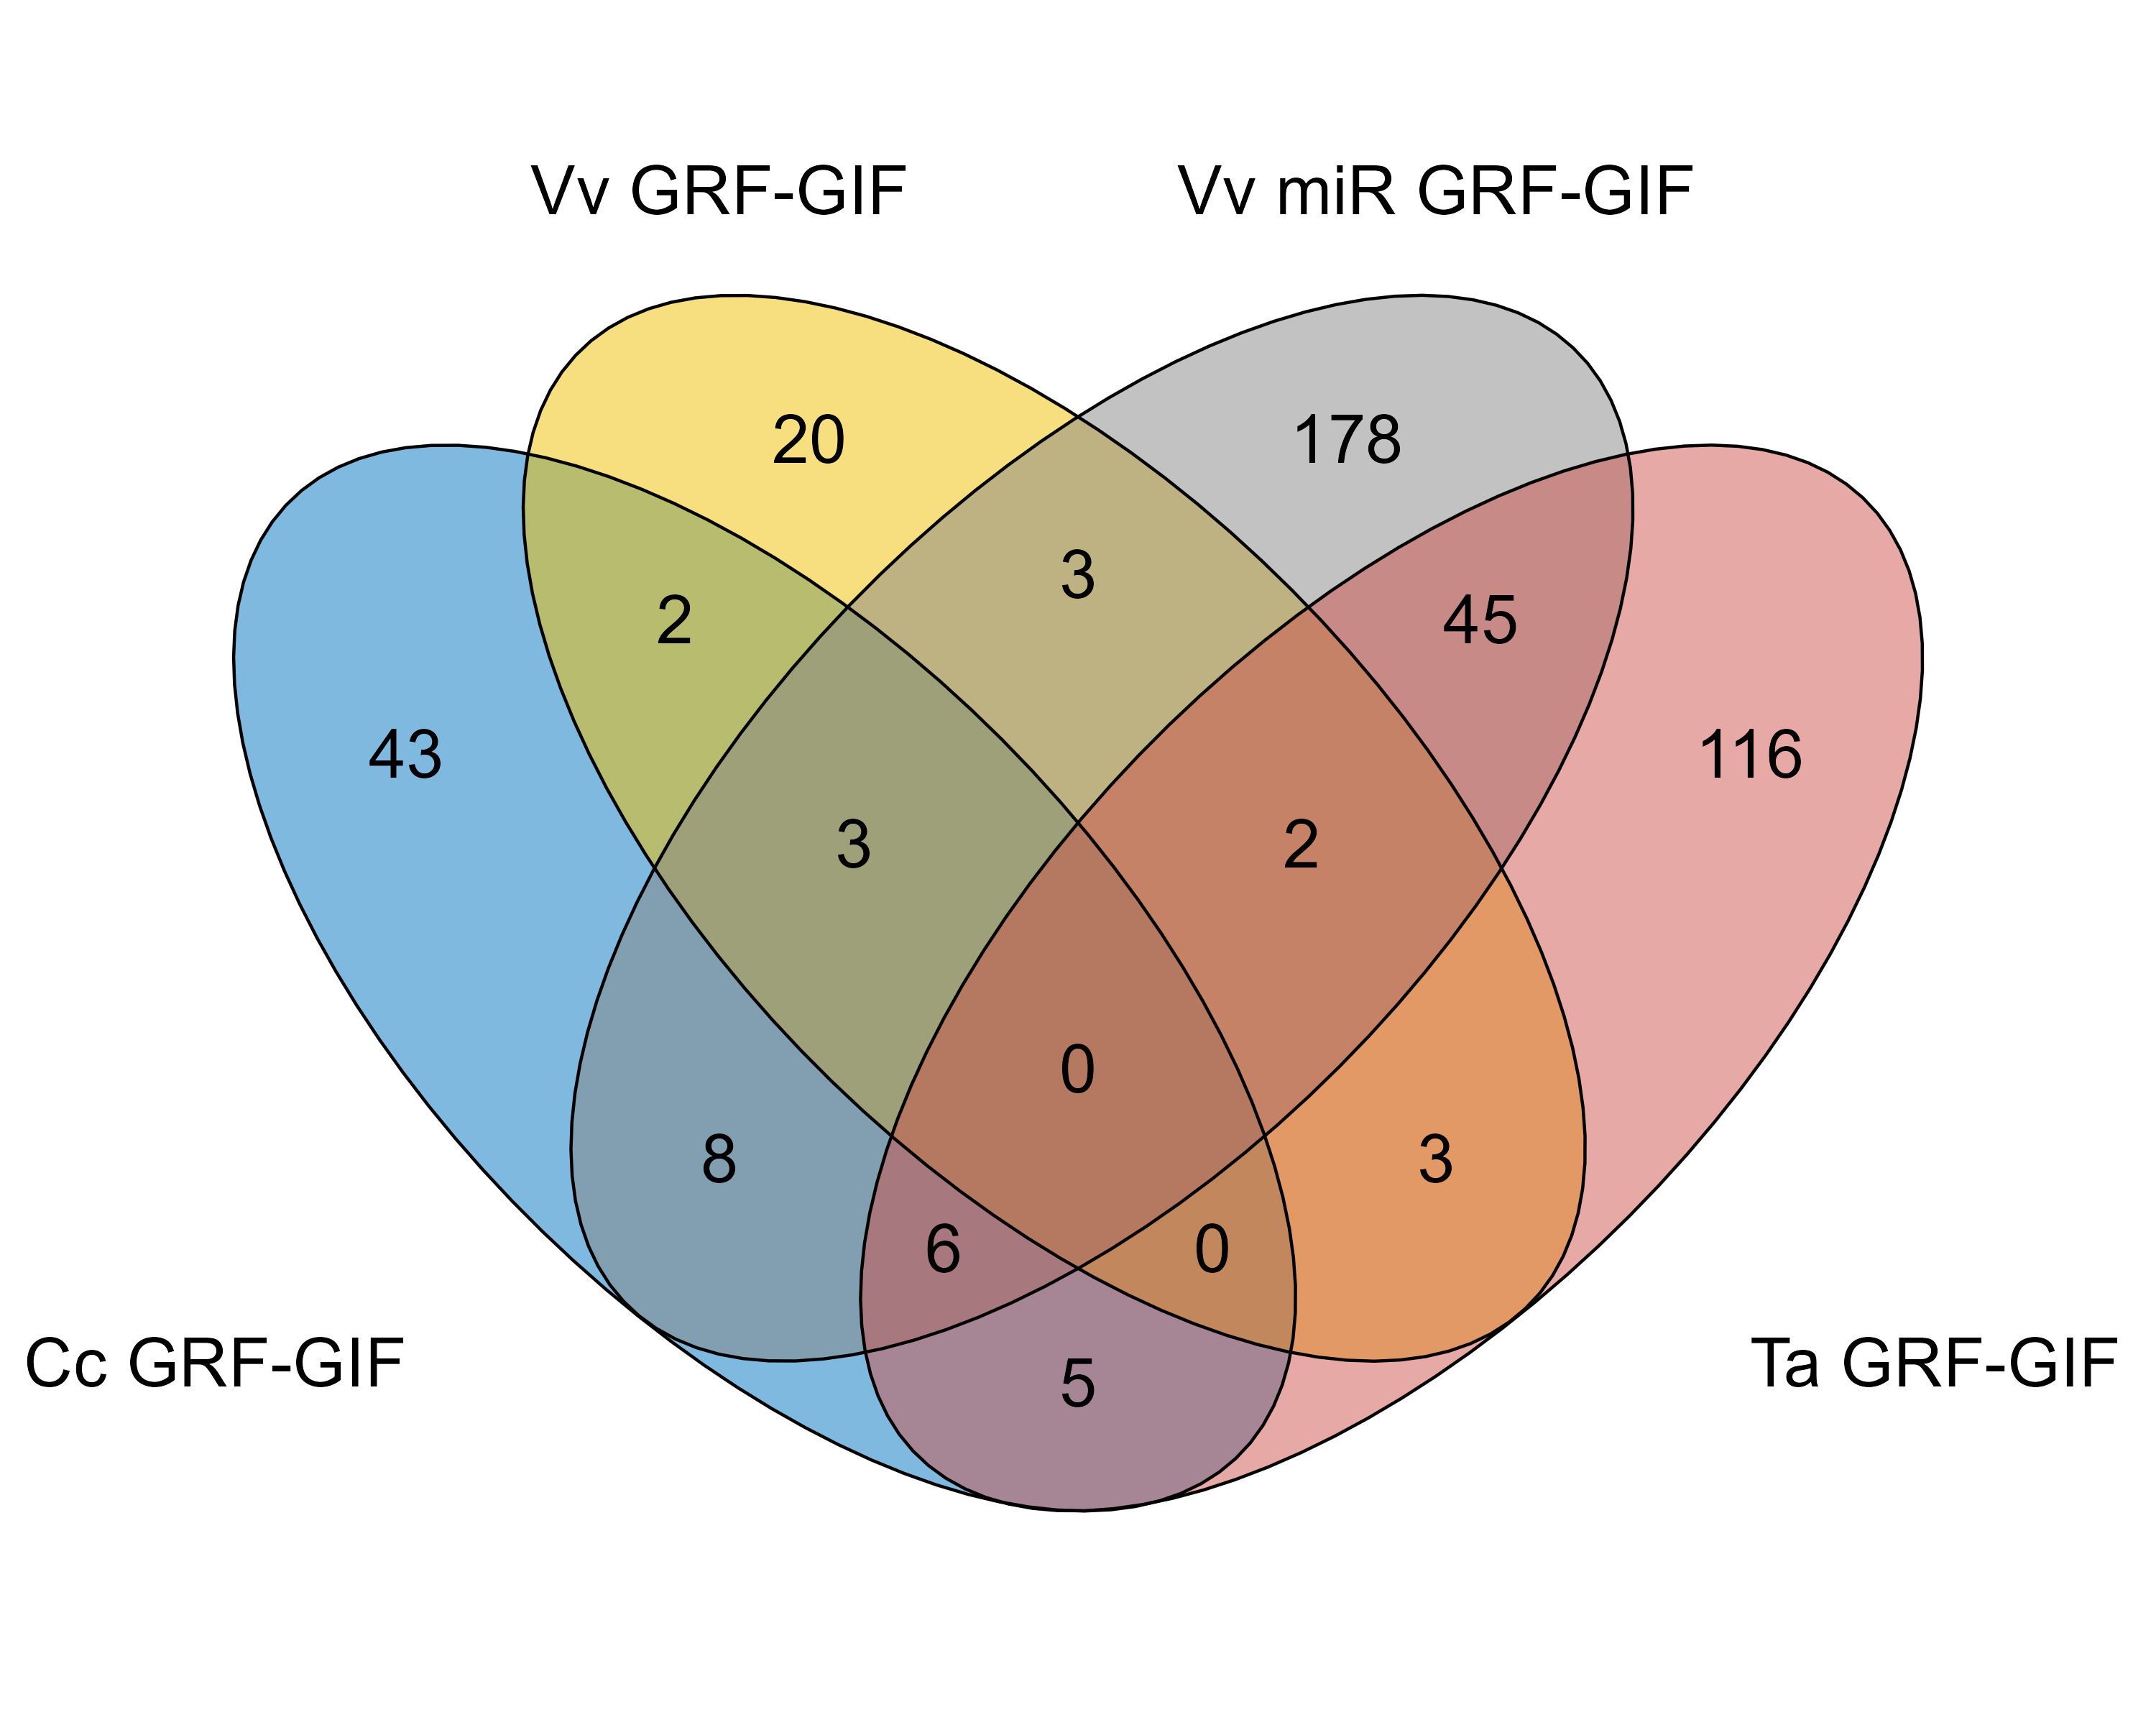
In this blog post, we’ll take a quick walk through how I created the 4-way Venn diagram (seen in Figure 4c) that compares DEGs between four different lines using R.
Data
Our analysis focussed on DEGs from F. vesca lines transformed with GRF-GIF chimeras from citrus (Cc GRF-GIF), grape (Vv GRF-GIF), grape with microRNA perturbation (Vv miR GRF-GIF), and wheat (Ta GRF-GIF).
Following differential expression testing using DESeq2, I exported the DEG names for each line to a new file, imported these into R and created a list of the data for the Venn diagram.
# Import DEG gene names
citris <- readLines("GRF-GIF_Citris_vs_Control_SigDEGs_names.txt")
vitis <- readLines("GRF-GIF_Vitis_vs_Control_SigDEGs_names.txt")
vitis_miR <- readLines("GRF-GIF_Vitis_miR_vs_Control_SigDEGs_names.txt")
wheat <- readLines("GRF-GIF_Wheat_vs_Control_SigDEGs_names.txt")

# Create list of all data
venndata <- list(
  "Cc GRF-GIF" = citris,
  "Vv GRF-GIF" = vitis,
  "Vv miR GRF-GIF" = vitis_miR,
  "Ta GRF-GIF" = wheat)
Visualization
For the Venn diagram visualisation, I used the R package ggvenn. If you haven’t already installed the ggvenn package, you can do so with the following commands:
# Install package
if (!require(devtools)) install.packages("devtools")
devtools::install_github("yanlinlin82/ggvenn")

# Load library
library(ggvenn)
I created a 4-way Venn diagram using custom color coding for each GRF-GIF line, making it easy to discern the contribution of each set. I also customised the plot by decreasing the line width, increasing the font size for the name of each line, and disabling the percentage visualisation.
# Plot 4-way venn diagram
ggvenn(
  venndata,
  fill_color = c("#0073C2FF", "#EFC000FF", "#868686FF", "#CD534CFF"),
  stroke_size = 0.5, set_name_size = 5, show_percentage = FALSE
)
The resulting diagram (below) provides a clear visual representation of shared and unique gene sets, aiding in the identification of conserved and species-specific responses to GRF-GIF expression.

Key Insights
Beyond visualisation, I used the gplots library to extract a table of the overlapping gene names for downstream analysis.
# Extract overlapping genes
library(gplots)
v.table <- venn(venndata)
print(v.table)
By exporting and analysing the intersection of gene sets, we were able to identify clusters of genes that were consistently regulated across certain groups of lines. These conserved gene clusters may represent fundamental mechanisms by which GRF-GIF chimeras regulate growth and development across species, providing a basis for future functional studies.
Summary
A 4-way Venn diagram is a powerful tool to explore cross-sample gene expression. It underscores the utility of comparative transcriptomics in understanding conserved genetic responses and tailoring biotechnological interventions.
If you’re interested in learning more about our study, you can read the full paper here. Otherwise, feel free to adapt the visualisation for your own datasets and explore the intersections within your gene sets.
Support
If you find this blog post helpful, please consider buying me a coffee on Ko-fi. Your support is very much appreciated!
Enjoy Reading This Article?
Here are some more articles you might like to read next: